



When an invitation arrives; a performance, a workshop, an evening out with friends. Before deciding whether to go, there's another calculation: the fare, the ticket, the journey home, the energy it will take and what else that money needs to cover.
The calculation identifies a question that public policy can often struggle to capture. What resources does someone need to take part in the life of a place? And what happens when the room for doing just that narrows?
The Office for National Statistics’ August 2026 Opinions and Lifestyle Survey gives us a starting point. Among adults in Great Britain, 89% identified the cost of living as an important issue facing the UK, 79% selected the NHS and 70% the economy. Respondents could select several issues: these are overlapping concerns, not competing shares of a single total. [1]
Those answers describe a national mood. They don't tell us what proportion of northerners holds each view. To understand our patch, we need to place them beside evidence about the circumstances in which people live, while keeping the different populations and periods visible.
The resulting picture raises questions about the North’s capacity for a shared life. Income shapes what's affordable. Health can affect the effort involved in reaching a venue or sustaining an activity. The availability of places to meet, read, make and talk determines whether participation has somewhere to happen.
In August, 55% of adults reported that their cost of living had increased over the previous month, down from 79% in April. Meanwhile, 62% said they were very or somewhat worried about rising living costs in the preceding fortnight. Among those reporting a monthly increase, 94% attributed it to food-shopping prices. That last figure applies to that subgroup, not all adults. [1]
A reduction in the share reporting further increases is welcome. It's not evidence that prices have returned to earlier levels, or that families have recovered what they lost. A household can face fewer new price rises while still struggling with the cost of necessities.
This matters when we talk about confidence. The decision to spend requires some belief that the next bill will be manageable. An affordable activity on paper might still feel beyond reach if the margin in the household budget is uncertain.
Nor can we assume that everything described as discretionary is inconsequential. A choir, a film, a book or a conversation outside the home can be part of how someone maintains a relationship with the world. Their value doesn't disappear when their cost becomes harder to justify.
That's an editorial argument about what deserves attention, not a claim that this survey measures the effects of missing a particular activity. The evidence establishes concern about costs. We have to be careful about the conclusions we build upon it.
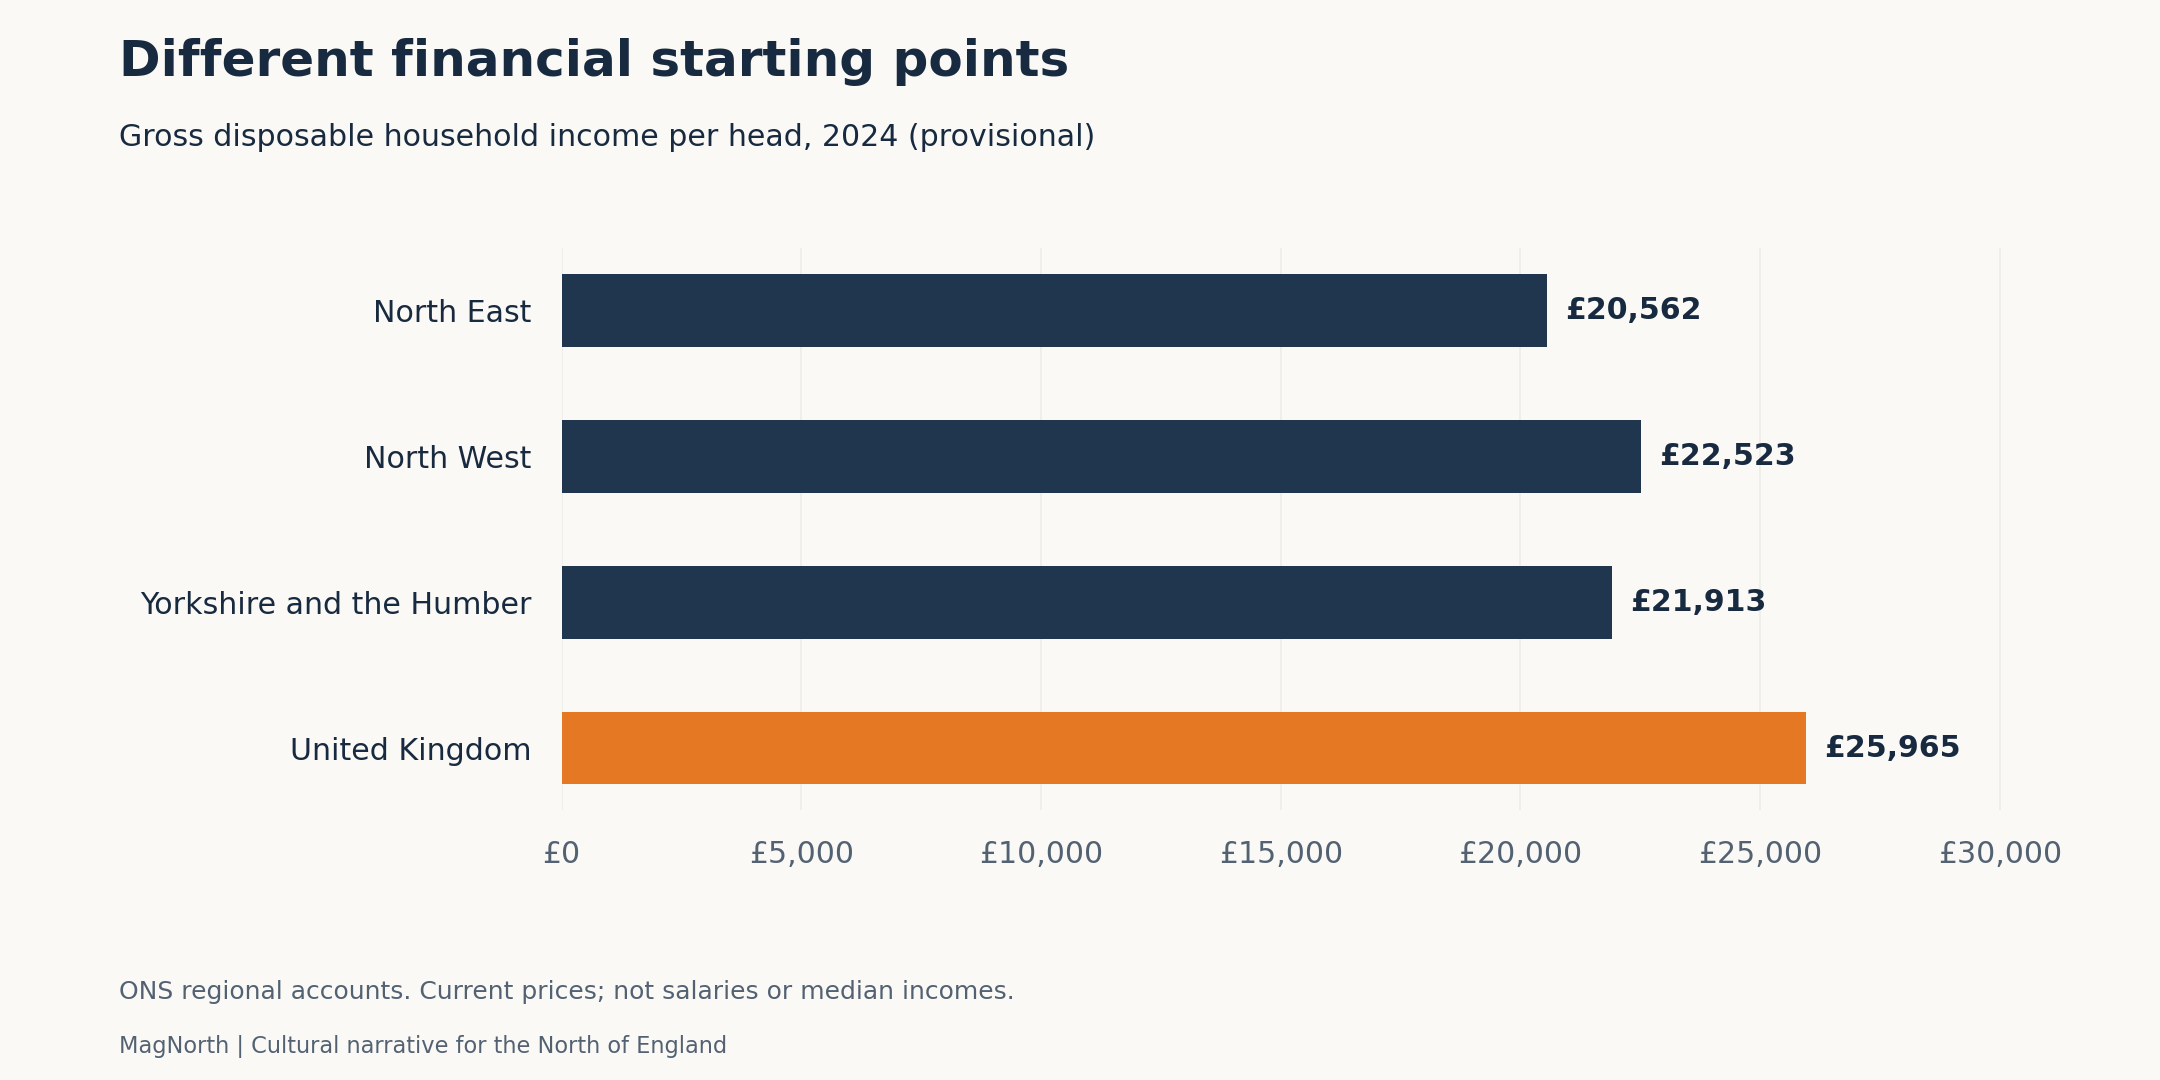
ONS regional accounts put provisional gross disposable household income per head in 2024 at £20,562 in the North East, £22,523 in the North West and £21,913 in Yorkshire and the Humber. The UK figure was £25,965. [2]
This is an accounting measure of resources available to households to spend or save after taxes and social contributions. It's not a salary, a median income or an amount sitting in every resident’s bank account. It includes children and people outside paid employment in its population denominator.
Nevertheless, all three northern regions sit below the UK average. That provides useful context for a national conversation about living costs. Similar demands on household budgets can meet different levels of financial resource.
The North contains considerable variation. On the same measure, the York and North Yorkshire Combined Authority stood at £26,911, above the UK average. Regional prosperity also tells us little about how income is distributed within a place. [2]
That distinction is importnat for cultural organisations serving a broad catchment. An institution can operate in an apparently prosperous area and still have residents nearby for whom the total cost of a visit is substantial. Equally, a region with lower average income contains households with very different resources and choices.
The useful response is to examine who can realistically participate, rather than build a programme around an imagined average resident. Ticket prices are one part of that examination. Timing, travel, childcare and the confidence to enter an unfamiliar space deserve consideration too.
Department for Work and Pensions local-area statistics offer another view. For the financial year ending 2025, the proportion of children under 16 in relative low-income families after housing costs was 28.9% in the North East, 29.1% in the North West and 30.8% in Yorkshire and the Humber, against 26.0% across the UK. [3]

These figures concern a defined age group and income measure. They shouldn't be substituted for estimates covering all dependent children. Relative low income measures a family’s position against an equivalised income threshold, accounting for household composition; it doesn't provide a complete account of a child’s circumstances.
Even with those boundaries, the regional pattern is consequential. It asks us to consider what a local offer means to families whose resources are restricted, and whether the opportunities described in a town’s cultural programme are practically available to them.
The issue reaches beyond a subsidised ticket. An activity might require materials, a journey or an adult with time to accompany a child. A free event can remove an important barrier while leaving others in place. None of that diminishes its usefulness; it helps make the next question more precise.
Schools, libraries, youth provision and accessible community spaces deserve attention here because they can bring opportunities into everyday settings. How they're funded, staffed and connected to local people is part of the participation question.
Children also have cultural lives of their own. Reading, drawing, making music and telling stories happen within families and communities as well as formal institutions. An income statistic can't measure the imagination or creativity present in a household. It can help identify unequal material conditions surrounding it.
The prominence of the NHS in the August survey has a particular resonance when placed beside the geography of health. ONS estimates for 2022–24 put healthy life expectancy at birth for males at 50.9 years in Blackpool and 52.1 in Hartlepool. The equivalent estimate for Richmond upon Thames was 69.3 years. For females, the figures were 51.8, 51.2 and 70.3 respectively. [4]
These are selected local examples, not northern averages. Healthy life expectancy estimates expected years in good or very good general health under the period’s health and mortality conditions. It's not an age at death, an individual prediction or a statement that everyone becomes ill at a particular birthday. Local estimates also carry uncertainty. [4]
Their significance is that a discussion about longer lives needs to consider the health in which those lives are lived. A place’s opportunities might be formally open to someone while being harder to reach or sustain because of illness, pain, fatigue or a caring responsibility.
The figures don't tell us which of those obstacles a particular person encounters. They do make it unreasonable to design public life around a single assumption about mobility, stamina or independence.
For venues and organisers, this points towards practical questions. Can someone sit down while waiting? Is access information clear before booking? Are there different ways to participate? Can a person leave and return without embarrassment? The answers will vary by activity, but asking them makes the invitation more credible.
Health and cultural policy meet in the organisation of everyday opportunities. That doesn't require claiming that a theatre visit prevents disease or that a workshop can compensate for inadequate healthcare. It requires noticing the conditions under which people can use what a place provides.
The government’s Community and Engagement Survey Arts Report for 2025/26 adds a useful comparison. Across England, 70% of adults in the most deprived tenth of neighbourhoods reported physical engagement with the arts in the preceding year, against 91% in the least deprived tenth. Digital engagement stood at 27% and 41% respectively. [5]
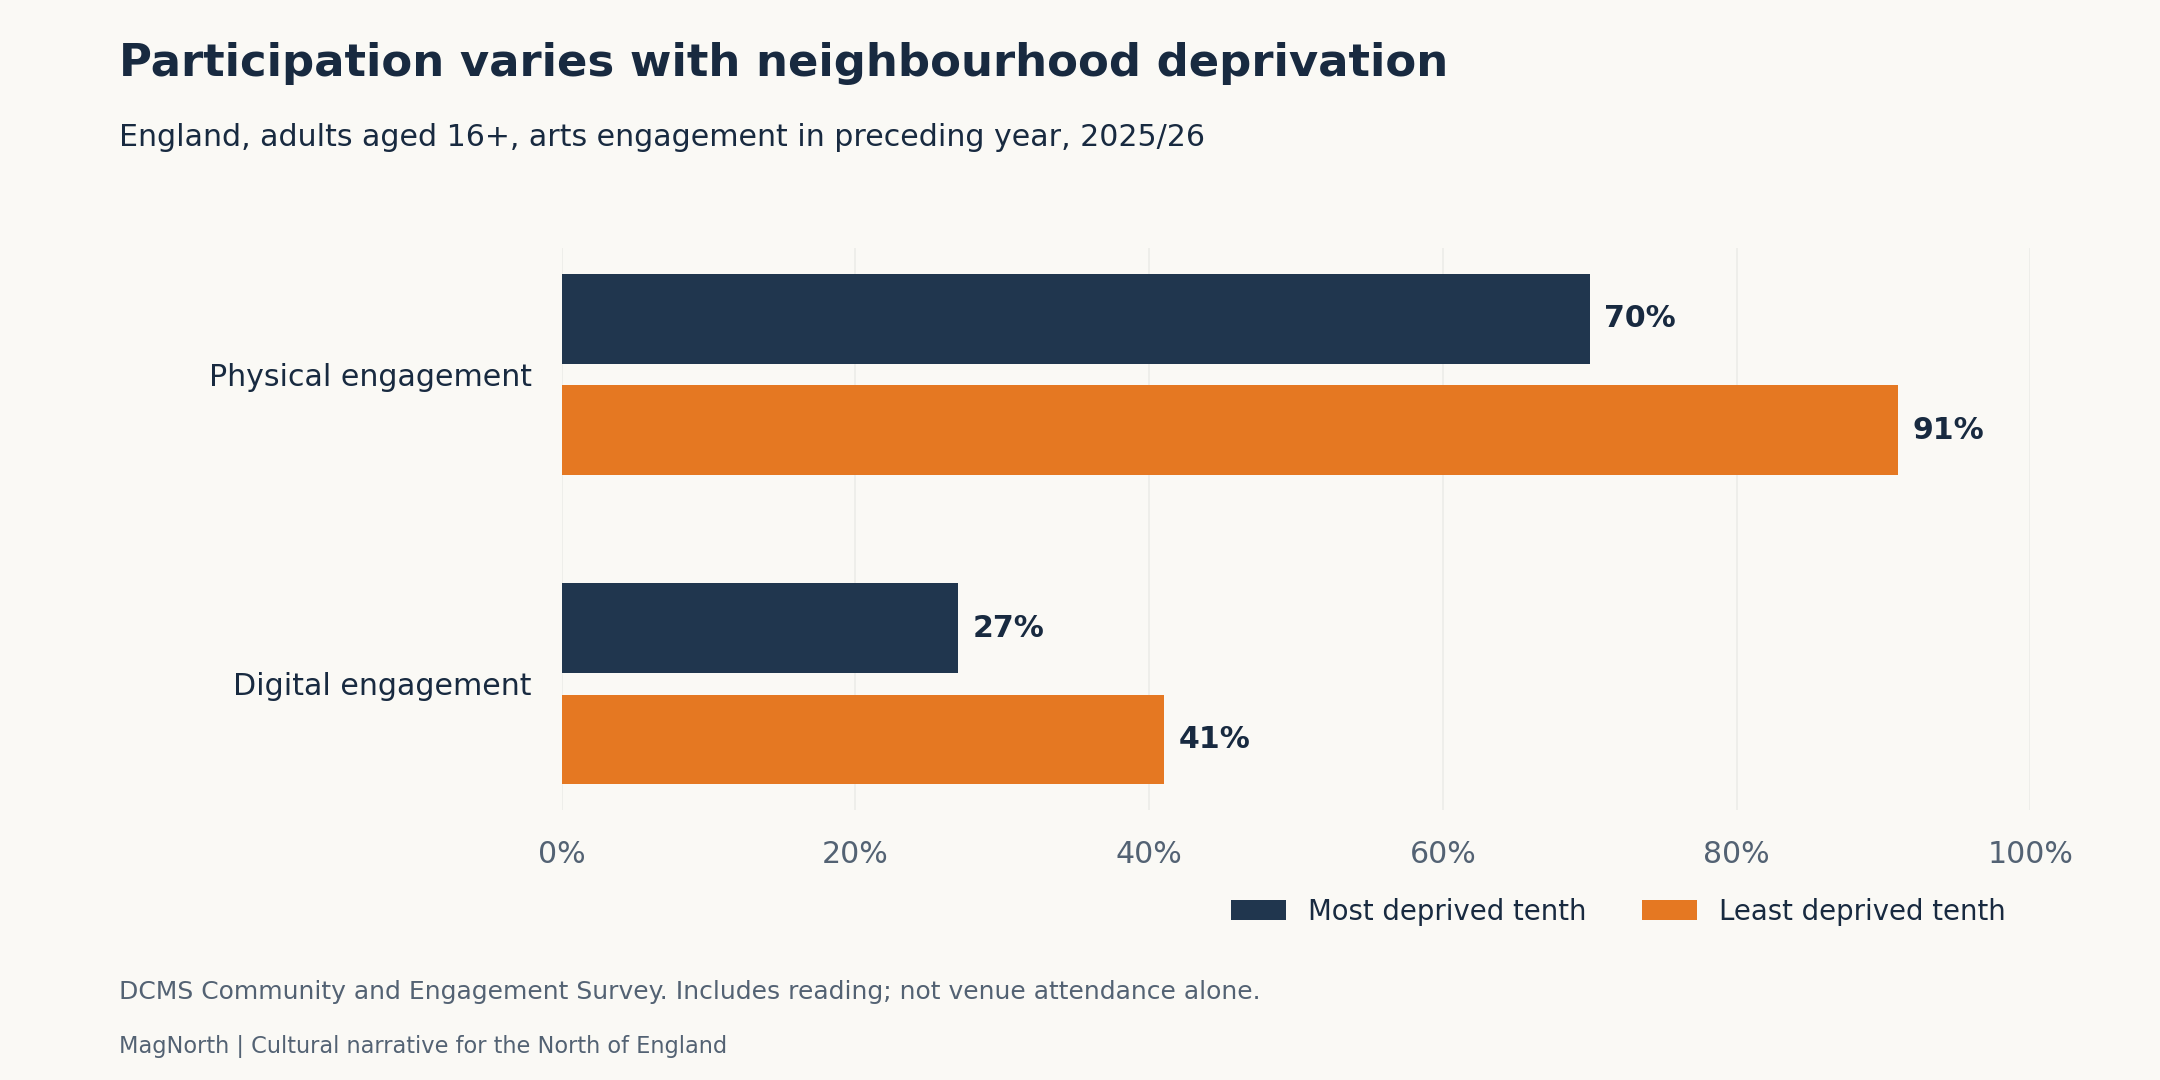
“Physical engagement” is broader than going to a venue: it includes activities such as reading books, graphic novels or magazines. These figures are England-wide, not northern estimates. They describe associations with neighbourhood deprivation, not proof that a particular person’s income caused their participation pattern. [5]
That breadth matters too. A high engagement rate doesn't establish frequent attendance at cultural venues, and a lower rate doesn't establish an absence of creativity. The question asked determines what becomes visible.
There's also a warning against turning the latest headline into a story of sudden cultural retreat. The government is investigating whether the reported annual fall in arts engagement reflects a real change or methodological differences following the transition between surveys. It can't yet safely carry that argument. [5]
The cross-sectional comparisons remain useful when reported within their limits. They show that opportunities to engage are unevenly distributed by place and circumstance. The digital figures also complicate the idea that putting an activity online will automatically remove inequality.
For the North, the constructive question is how institutions can examine their own reach. Who attends regularly? Who's missing from the available evidence? Which local partners understand the practical difficulties involved? Attendance totals alone can't resolve those questions, though good local information can help.
There's a tendency to discuss culture through what is most visible: a major exhibition, a festival weekend, a new building. Those things can be valuable. The resources needed to make use of them often receive less attention.
A shared life depends on repeated possibilities. Somewhere to spend time without a large purchase. An activity close enough to reach. Information that makes sense. A person who welcomes you back. These are proposed tests of a local offer, rather than outcomes measured by the datasets above.
The implication for public investment is to assess access alongside provision. A building’s success can be considered through who uses it and under what conditions. A programme’s ambition can include the effort made to reach people whose attendance requires more planning, support or money.
That work needs continuity. Relationships between institutions and communities develop through repeated contact. Short projects can introduce something valuable, but sustained participation requires somewhere for the relationship to go when the project ends.
It also needs honesty about responsibility. Cultural organisations can - and do - adapt their practice and widen opportunities. They can't themselves correct household incomes, provide a comprehensive transport network or resolve inequalities in health. Those issues require decisions and resources elsewhere in public life.
Recognising those limits strengthens the case for collaboration. A local authority, health service, transport provider, school and cultural organisation might each see a different part of the same practical problem. Their ability to work together deserves scrutiny alongside the individual programme they deliver.
The August survey records what people are concerned about. The northern figures help describe the circumstances within which those concerns are experienced. The participation evidence supplies a further reason to ask who gets to make use of the opportunities around them. Taken together, they support inquiry; they don't establish a single chain of causation.
For MagNorth, that inquiry returns to the quality of life available in the places we call HOME . The room to read, create, gather and contribute is worth considering alongside the ability to meet a bill. It forms part of what people can reasonably want from the place they call home.
An invitation becomes meaningful when there's a realistic way to accept it. That's a demanding, practical standard for the North’s public life - and a useful place to start.
[1] ONS, Public opinions and social trends, Great Britain: August 2026; published 18 September 2026. Adults aged 16+; fieldwork 5–30 August; 3,560 respondents; weighted estimates. https://www.ons.gov.uk/peoplepopulationandcommunity/wellbeing/bulletins/publicopinionsandsocialtrendsgreatbritain/august2026
[2] ONS, Regional gross disposable household income, UK: 1997 to 2024; published 19 August 2026. 2024 estimates provisional, current prices. https://www.ons.gov.uk/economy/regionalaccounts/grossdisposablehouseholdincome/bulletins/regionalgrossdisposablehouseholdincomegdhi/1997to2024
[3] DWP, Children in low income families: local area statistics, financial year ending 2025; published 26 March 2026. Under-16 relative low income after housing costs; regional table. Revisions and methodology changes mean older releases should not be spliced into an unqualified trend. https://www.gov.uk/government/statistics/children-in-low-income-families-local-area-statistics-2022-to-2025/children-in-low-income-families-local-area-statistics-financial-year-ending-2025
[4] ONS, Healthy life expectancy, UK: between 2011 to 2013 and 2022 to 2024; published 19 February 2026. Period estimates, selected local authorities; uncertainty intervals available in accompanying data. https://www.ons.gov.uk/peoplepopulationandcommunity/healthandsocialcare/healthandlifeexpectancies/bulletins/healthstatelifeexpectanciesuk/between2011to2013and2022to2024
[5] DCMS, Community and Engagement Survey 2025/26 — arts report; published 16 September 2026. England, adults aged 16+; annual survey transition and trend caveat explained in report. https://www.gov.uk/government/statistics/community-and-engagement-survey-202526-arts/community-and-engagement-survey-202526-arts-report





